www.BioTopics.co.uk
Site author Richard Steane
The BioTopics website gives access to interactive resource material, developed to support the learning and teaching of Biology at a variety of levels.

Predator-prey interdependence

When predators are successful at catching prey, they will reproduce more reliably and their species will increase in numbers, whereas the numbers of their prey will fall. However, in following years the larger predator population will struggle to find enough food to support them, and their numbers will fall because of the reduced population of prey species. Eventually the situation will reverse itself as the number of prey increase due to less predation.

If the ecosystem is large enough and other factors do not have an excessive effect, this can result in a situation in which populations of predator and prey rise and fall at regular intervals, with a small time lag between them. There is an inverse relationship between the number of predators and prey, and vice versa.

The lynx and the snowshoe hare

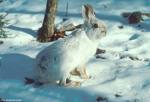
MacLulich published some classical information in 1937. This population data was obtained from records of lynx and snowshoe hare populations as evidenced by numbers of skins caught by trappers from 1845 onwards. It is especially clear-cut as snowshoe hare are the main prey of Canadian lynx, and there is no other significant predator involved. It would be a useful exercise to use a spreadsheet to convert this extracted data into a graph (data at base of table).
Time elapsed
years
Population of
snowshoe hare
(thousands)
Population of
lynx
(hundreds)
0 20 10
2 55 15
4 65 55
6 95 60
8 55 20
10 5 15
12 15 10
14 50 60
16 75 60
18 20 10
20 25 5
22 50 25
24 70 40
26 30 25
28 15 5
Above data in excel formatbare data

Click here for more about the lynx in Canada and their relationship to the snowshoe hare, including a graph of 90 years of similar data.

You can follow these links for basic background information from the Government of Newfoundland and Labrador on the lives of the snowshoe hare and lynx.

Other populations follow a similar cyclical pattern. The Norweigian lemming is a prime example.

Simulation software

Most of this seems to involve Java applets, which take little while to load, but are then quite effective.
But: there have been several warnings against Java recently.

XGROW is a java applet - a simulation exercise - which will repeatedly calculate (and plot) theoretical data about growth of populations to cover 3 model classical population growth scenarios: (buttons across the top) There are a number of sliders to enable users to alter variables - then click on Start to see the effect!

Yet another Introduction to the Predator Prey Problem attempts to predict the relationship in populations between a population of foxes and rabbits isolated on an island. It has some complicated looking formulae, but a good graph plotting section (click on the button at the bottom). Or click here to go directly,

WATOR Predator-Prey Simulation is another interactive Java Applet based webpage which continuously plots graphs of shark and other fish numbers, with sliders to vary various values. Its main drawback is an annoying pixellated display.

You may find this Three Trophic-Level Ecosystem Simulator quite interesting. To me it is rather baffling but I would be interested if any anyone (teachers or students) finds it useful.

Lower-tech alternatives

The Predator-Prey Simulation available from https://www.accessexcellence.org/AE/AEPC/WWC/1991/predator.html involves the use of cards to represent foxes and rabbits, and looks very useful as a classroom exercise.

The worksheet from https://www.biologycorner.com/worksheets/predatorsim.html is practically the same.

Background information

Interspecific Interactions, from the University of Illinois, gives a very comprehensive treatment (50 slides) of the topic of interactions between organisms.


www.BioTopics.co.ukHome Contents Contact via form Contact via email Howlers Books WWWlinks Terms of use Privacy