|
Site author Richard Steane
|
The BioTopics website gives access to interactive resource material, developed to support the
learning and teaching of Biology at a variety of levels.
|
|
Decomposers - bacteria and fungi - also obtain
energy from dead animals and plants, and their products. In many ways they
resemble animals, because they cannot make their own food, and instead rely
on breaking down products originating from plants, using a similar digestion process.
The main difference is that decomposers break down dead remains where they
fall, from the outside (external digestion). In so doing, they cause decay, which gets
rid of dead remains, and also recycle and release their constituent chemical elements,
enabling plant and animal growth to continue.
The feeding relationships between producers and different consumers may
be expressed in a variety of ways. In each case, organic food materials may
be seen to pass on from one trophic level to another - one stage being food
for the next. Another way of looking at it is in terms of energy flow - as
the energy from sunlight, trapped in organic substances, is passed from one
stage to the next.
Either way, the conversion is not very efficient, as there
are large losses at each stage.
Organic materials and energy are wasted, in a number of ways:
- as heat, a by-product of respiration and all energy interconversions
- in indigestible materials,
passed out unchanged from the digestive system of animals
- in movement, in order
to get food
- etc.
Explain below in your own words what is meant by the following expression: All flesh is grass.
Plants contain organic substances which are passed on to herbivores and carnivores.
- Food Chains are simple
statements showing (with arrows) the direction of movement of both food and
energy between different trophic levels.
 |
 |
 |
 |
 |
| seaweed |  |
periwinkle |  |
gull |
In what units is biomass measured?
> mass units - g/kg/tonnes - usually
per unit area per year
- Food Webs are more realistic
because they show alternative pathways for transfer of food and energy, effectively
combining several food chains. They may also show that organisms can
occupy different trophic levels, and which organisms are in competition
with one another. For example, if one organism is reduced in numbers
(for any reason), then organisms dependent on it for food will also tend
to be reduced, whereas competitors will benefit.

|
||||||

|

|
|||||

|

|
|||||

|

|

|
||||

|

|
|||||

|

|

|
||||

|

|
|||||

|

|
|||||

|
From the illustrations above, give examples of the following:
- tertiary consumers
>sparrowhawk >seal >seagull
- producers
>seaweed >oak tree
- primary consumers
>moth caterpillars >periwinkles / limpet
- an organism which can be a secondary or a tertiary consumer
>seagull / herring gulls
- a food chain with 4 trophic levels
oak -->moth caterpillars -->robin -->sparrowhawk
seaweed periwinkle/limpet octopus/crab/starfish seagull/seal
- things being acted upon by decomposers
>dead tree >apple
If the number of limpets in an area of seashore are reduced, which organism
will probably:
- suffer directly from reduced food supply?
>starfish >crab >seal >seagull
- benefit, at least in the short term?
>seaweed >periwinkle / octopus
The following diagram shows the energy flow in a woodland food chain. At the base is the amount of light energy falling on the wood, and the square boxes showing the trophic levels are drawn with their areas proportional to the amounts of energy converted from the level below. Losses of energy due to respiration, and also energy lost to decomposers, are shown at each level.
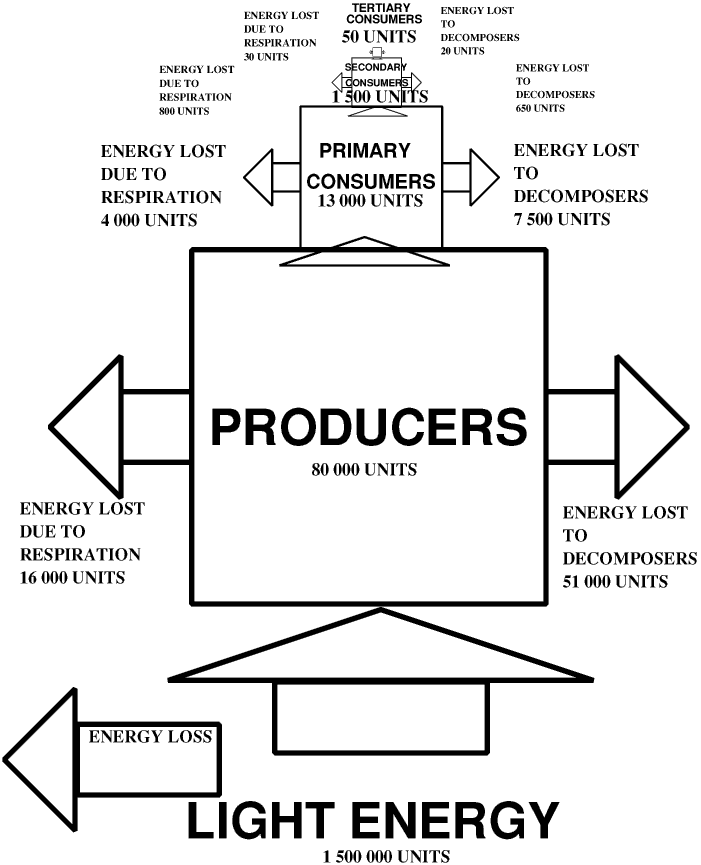
What percentage of the light energy did the producers incorporate into their biomass?
Show your working.
> 80 000/ 1 500 000 x 100% = 5.3%
Suggest TWO reasons why a large amount of light energy was not incorporated into the producers' biomass.
> Some light is reflected away - especially green light
> Other energy wasted as heat -
lost to the environment
Calculate the percentage efficiency of conversion of energy
from producers to primary consumers > 13000/80000x100%=16%
from primary consumers to secondary consumers >1500/13000x100%= 11.5%
from secondary consumers to tertiary consumers > 50/1500x 1005 = 3%
Why do you think food chains rarely have as many trophic levels as this?
> Very little energy is left at
the top of the food chain.
> kilojoules per square metre per year?
What sort of time scale would be necessary to use in this sort of
investigation? Explain why.
> (whole) years - because input of solar energy varies according
to time of year, and so do quantities of biomass at each level.
|
|
chiffchaff

|
sparrow hawk

|
vole

|
carabid beetle
|
(adult of) winter moth

|
(adult of) mottled umber moth

|
| Animal | Number
recorded |
Food which each animal eats |
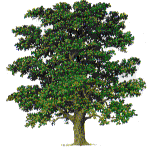
| winter moth larva | 42 | oak leaves |
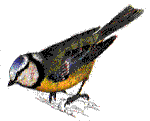
| chiffchaff | 6 | mottled umber moth and winter moth larvae |
| mottled umber moth larva | 51 | oak leaves |
| vole | 3 | oak fruits |
| sparrowhawk | 2 | chiffchaffs and bluetits |
| bluetit | 3 | mottled umber moth and winter moth larvae |
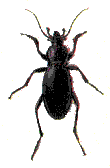
| carabid beetle | 5 | mottled umber moth and winter moth larvae |
Using the information above, name the animals in the feeding levels shown below, and work out how many animals were at each feeding level:
| Feeding level | Names of organisms | Number | Biomass |
| tertiary consumers | sparrowhawk | 2 | 1 |
| secondary consumers | chiffchaffs and bluetits, carabid beetles | 6+3+5=14 | 6.6 |
| primary consumers | winter moth larva, mottled umber moth larva, vole | 42+51+3=96 | 12.5 |
| producers | oak tree | 1 | 177 |
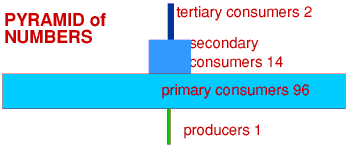

Suggest TWO reasons why the above information may not be truly representative of the pyramid of numbers for the oak tree ecosystem at the three feeding levels.
> children could have frightened away some animals so not counted them
> it was only a "snapshot" at a
certain time - of day/ of year etc
- some species would fly and so numbers should be spread over several
tree